
A groupe agraphe × Group Crazy Pineapple collaboration
Dashboards and reports
Knowing where the business stands should not take an hour of spreadsheets. We bring your sales, costs and lead times together in a clear dashboard that updates automatically.
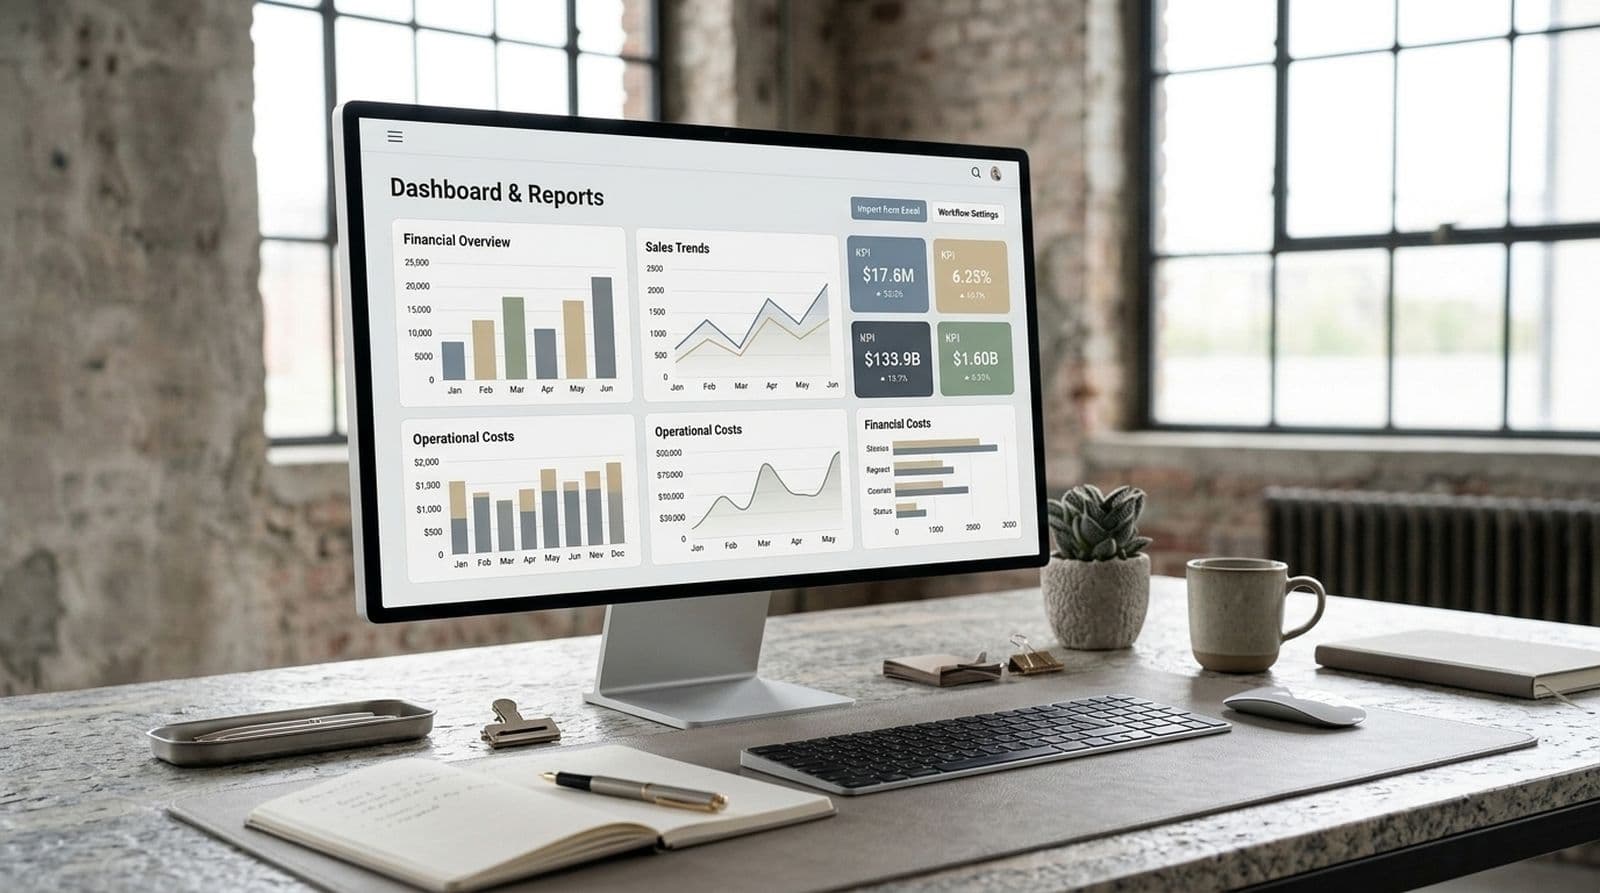
Who is it for?
- Owners who want to follow their sales targets
- Teams that still produce their reports by hand
- Businesses that want to compare their quotes and their suppliers
What you get
Everything on one screen
The numbers that matter to you, in the same place.
Always up to date
Data refreshes by itself from your tools.
Easier decisions
You quickly see where you stand against your targets and what needs attention.
How it works
- 01

Choose the indicators
We keep a few figures, the ones that are really useful.
- 02
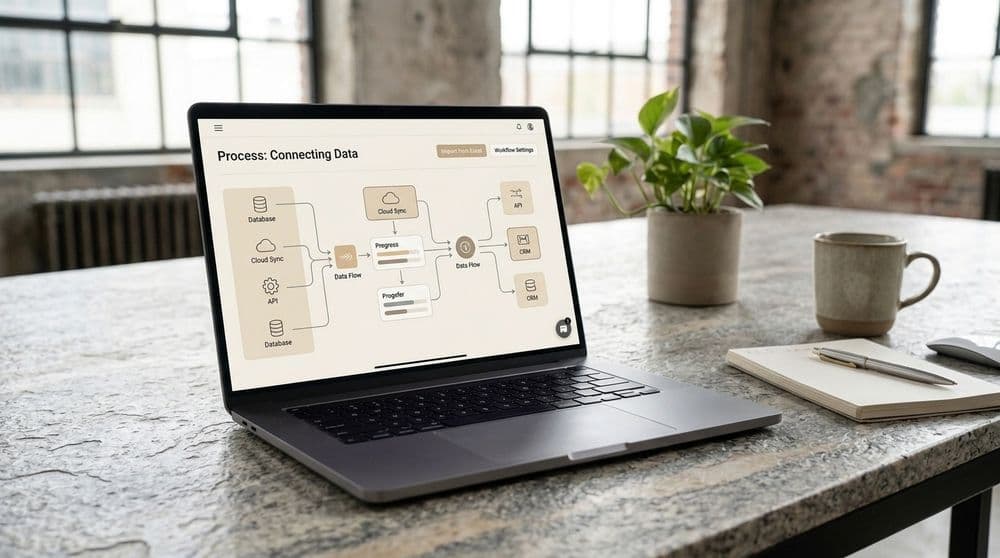
Connect the data
We link your sources: sales, orders, files.
- 03
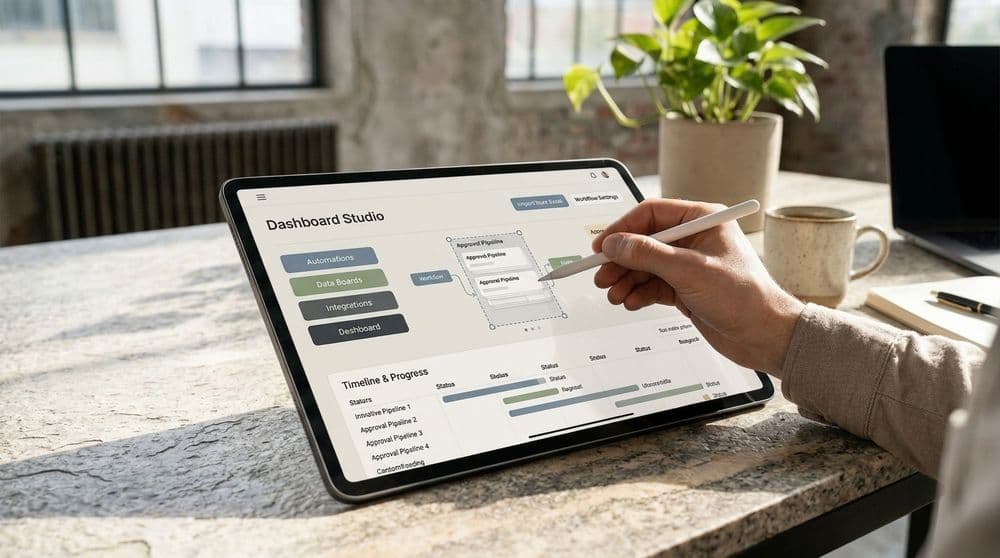
Refine
We adjust the display with you after a few weeks.
Frequently asked questions
Do I have to change my software?
No. The dashboard connects to what you already use, or to files that we organize.
Who can see the numbers?
Only the people you authorize. We define access with you.
Can we track a sales target?
Yes. We can show the target amount, what is signed, what is in progress and the pace needed to get there.
Other services
Stock and reorder tracking
Know ahead of time when to reorder your packaging and materials, to avoid stockouts.
Custom applications
A tool built around the way you work, instead of spreadsheets and emails.

Let's talk about your project
Tell us about your situation, even if it is not very clear yet. We will come back with concrete ideas.
Write to usOr call us: 438 738-3672
Visit groupcrazypineapple.com